
We are facing double burden on child’s nutrition status (facts and figures)
- In 2014, nearly 156 million children are stunted (low height for age) and 50 million are affected by wasting (low weight for height) throughout the world. On the other hand there are other 41 million children who are obese or overweight and this is increasing 30% every year among low and middle income countries then rest of the world.
- Malnutrition (underweight as well as overweight) results into lot of morbidity and moralities throughout the world.
- As per WHO 2014 data, 50% of under-five mortality occurs due to under nutrition.
What happens if child is underweight?
- Decreased immunity
- More chances of getting infection
- Delayed development
- Decreased cognitive skills
It’s a vicious circle: Weak girl becomes a weak adolescent> a week women> a week mother> will deliver a week child.
What happens if child is overweight?
- More risk for childhood diabetes
- More risk for non-communicable disease like hypertension, Diabetes mellitus , stroke and hyper-cholestrolemia
- Depression is very common during adolescent phase
Overweight child becomes overweight adult
Is it so difficult to identify and control this nutrition disparity?
- No, Not at all
- Growth Charts is the easiest and simplest solution for this
- World health organization (WHO) has developed Growth Charts by which parents and family can easily monitor growth pattern of their child and can act early if the growth pattern is abnormal. It’s a monitoring tool by which mother can easily identify whether her child is growing healthy or not.
How to read growth charts?
While reading growth charts, direction of the growth curve is very important:
- Upward growth curve: child is growing well
- Flat growth curve: child has not gained weight
- Downward growth curve: indicates loss of weight
If your child’s curve is getting flat or have downward curve, you should contact Pediatrician immediately as it could be early signs of malnutrition.
How Growth Book app can be useful for making Growth Charts?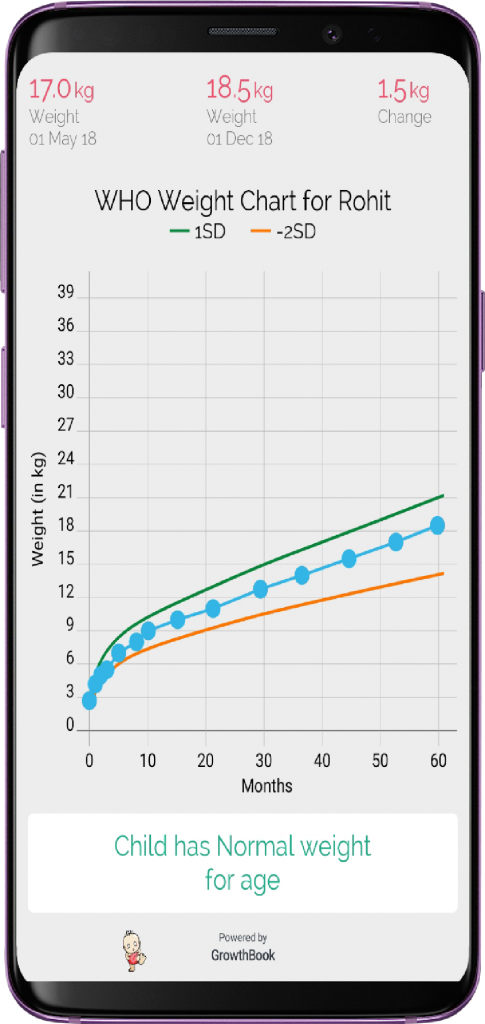
- Makes graphs using WHO Z scores
- Very easy and simple to use
- Can add multiple records of your child
- Can save and share graphs
- Also give conclusions, so parents have not to read Z scores and percentiles.
- Also have other parenting features like vaccinations, Milestones and Daily Health Tips
Attention: Plot Growth chart every month till age of 5 years.
To have more information about child growth and development , download our app GrowthBook now.